Data are from settlement and without any further processing - but good
enough for pictures.
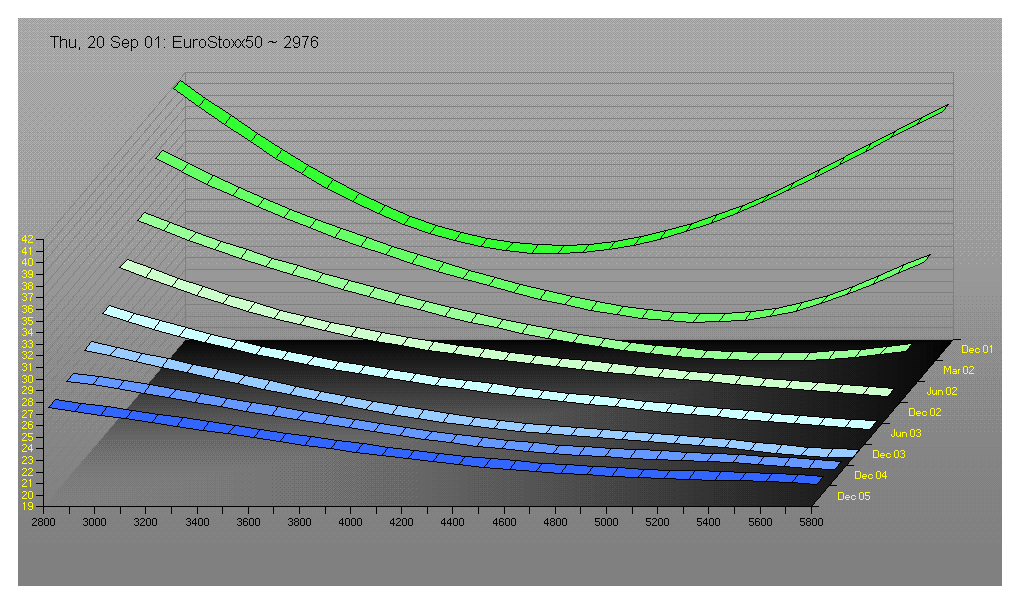
First the EuroStoxx50 2 weeks after the 911 attacks:

One recognizes a very high volatility for the next expiries and a kind
of 'inverse' term structure for nearly all strikes
(up to 5800 for Dec03 … Dec05).
Then the DAX 4 weeks after a really deep low:
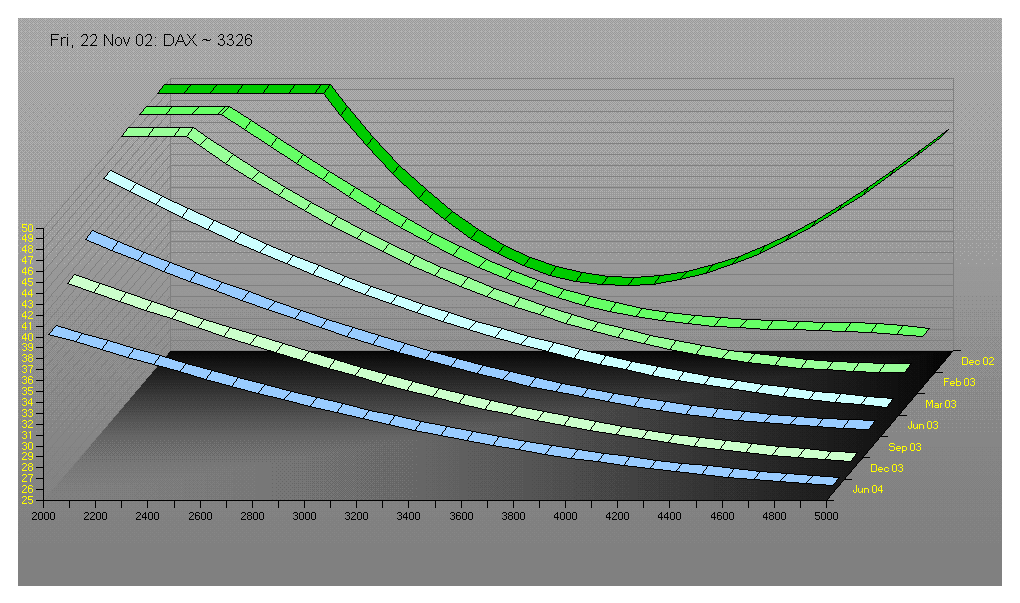
Volatility is cut off at 50. Besides an inverse term structure (on the long run) it seems to look quite usual with a high volatility for the next expiry.
One has to look closer ATM to see a rare phenomenon: a hump.
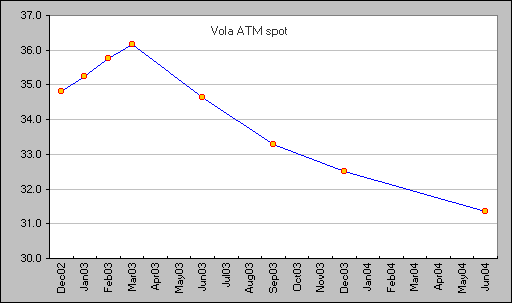
I am missing the original data from (2 weeks?) before, but you can see it as the red line in the final picture:

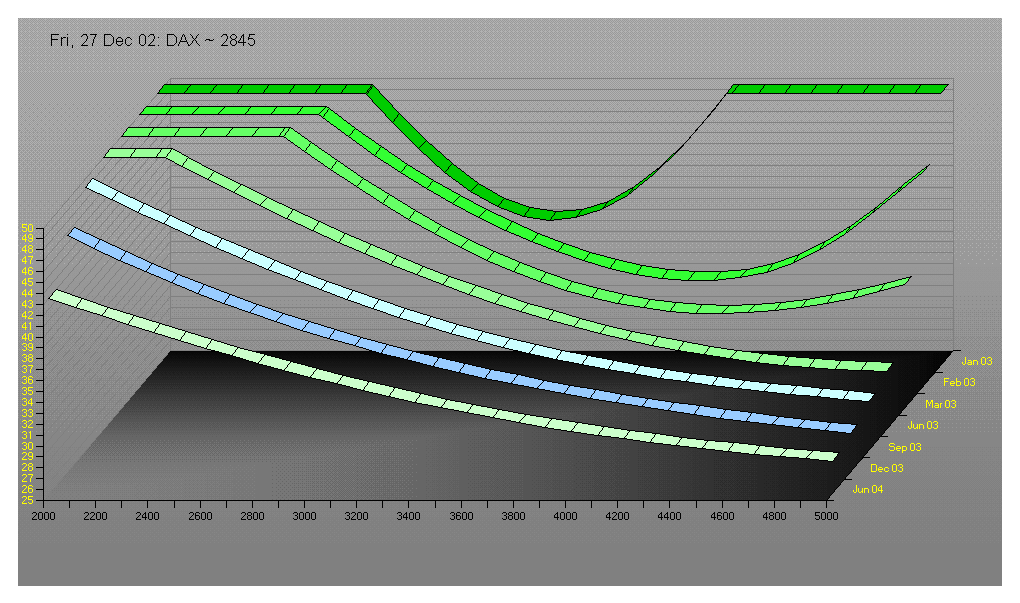
One month before (and close to triple witch) it looked like this:
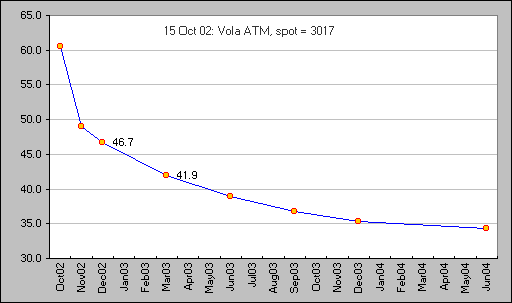
Even having in mind a change in expiries (Nov02 dropped out) it seems obvious that the overall level dramatically decreased. The smallest change is for the long expiries and the most for the next upcoming ones (and somewhat inverse to the Eurostoxx picture at the beginning).
The break down here was fast enough to produce a hump. At least for EuroStoxx and SMI it was quite similar. It drifted out to the upside later.
